How to Model Hotspots for Business Development (part four: the finish)
Ewoud Liberg, November 1st 2015
Should your organization invest time and money in exploring the hotspot you found? Can your organization expect profitable and future-proof new or renewed products and services? The building blocks for the answers are here. Now it is a matter of putting them into a workable model which is helpful for rating and presenting your findings. This is the final mile of the series… let’s go!
The first part of the model is about the size of the hotspot. A larger hotspot means more impact and more complexity. Complexity in this case is a good thing, because greater complexity incorporates more possibilities. More possibilities is like music for business developers. The more possibilities, the greater the party.
The second part of the model indicates how likely it is that your organization can take advantage of the chances bubbling up from the hotspot. As explored in part three not all organizations are ready for business development. If your organization is not ready, don’t start; because searching, designing and building something new requires attention and wide support.
Size of the hotspot
The first set of building blocks of the model are the five most important clues which were explored in part 2 of this series. These clues indicate the presence of a hotspot under your organization’s base. If the hotspot is there, then business development can deliver promising results if your organization is ready for it. The presence of the hotspot tells me that fundamental changes are taking place that will lead to obsolete products, services, and business models. It does not tell me what products or services need renovation or what new products and services there are to be designed and developed. These questions will be answered during your business development project.
The size of the hotpot I calculate via rating the five clues on a scale from 0 to 10. I estimate the ratings on the basis of interviews and observations. Again, this is nothing scientifically. Remember it is not possible to predict a volcanic eruption. We only have indicators to work with.
Customers I have worked for do not want to share their findings about the size of their hotspot or the extent to which they are ready to engage, because they don’t want to alert competition. I respect this, and am therefore choosing a company I have not worked for (yet). For this example let’s put the Tesla company in mind and let’s start by rating the five clues for the automotive line of business, and see what we get. Please don’t focus on the ratings I give from my observation. Focus on the methodology.
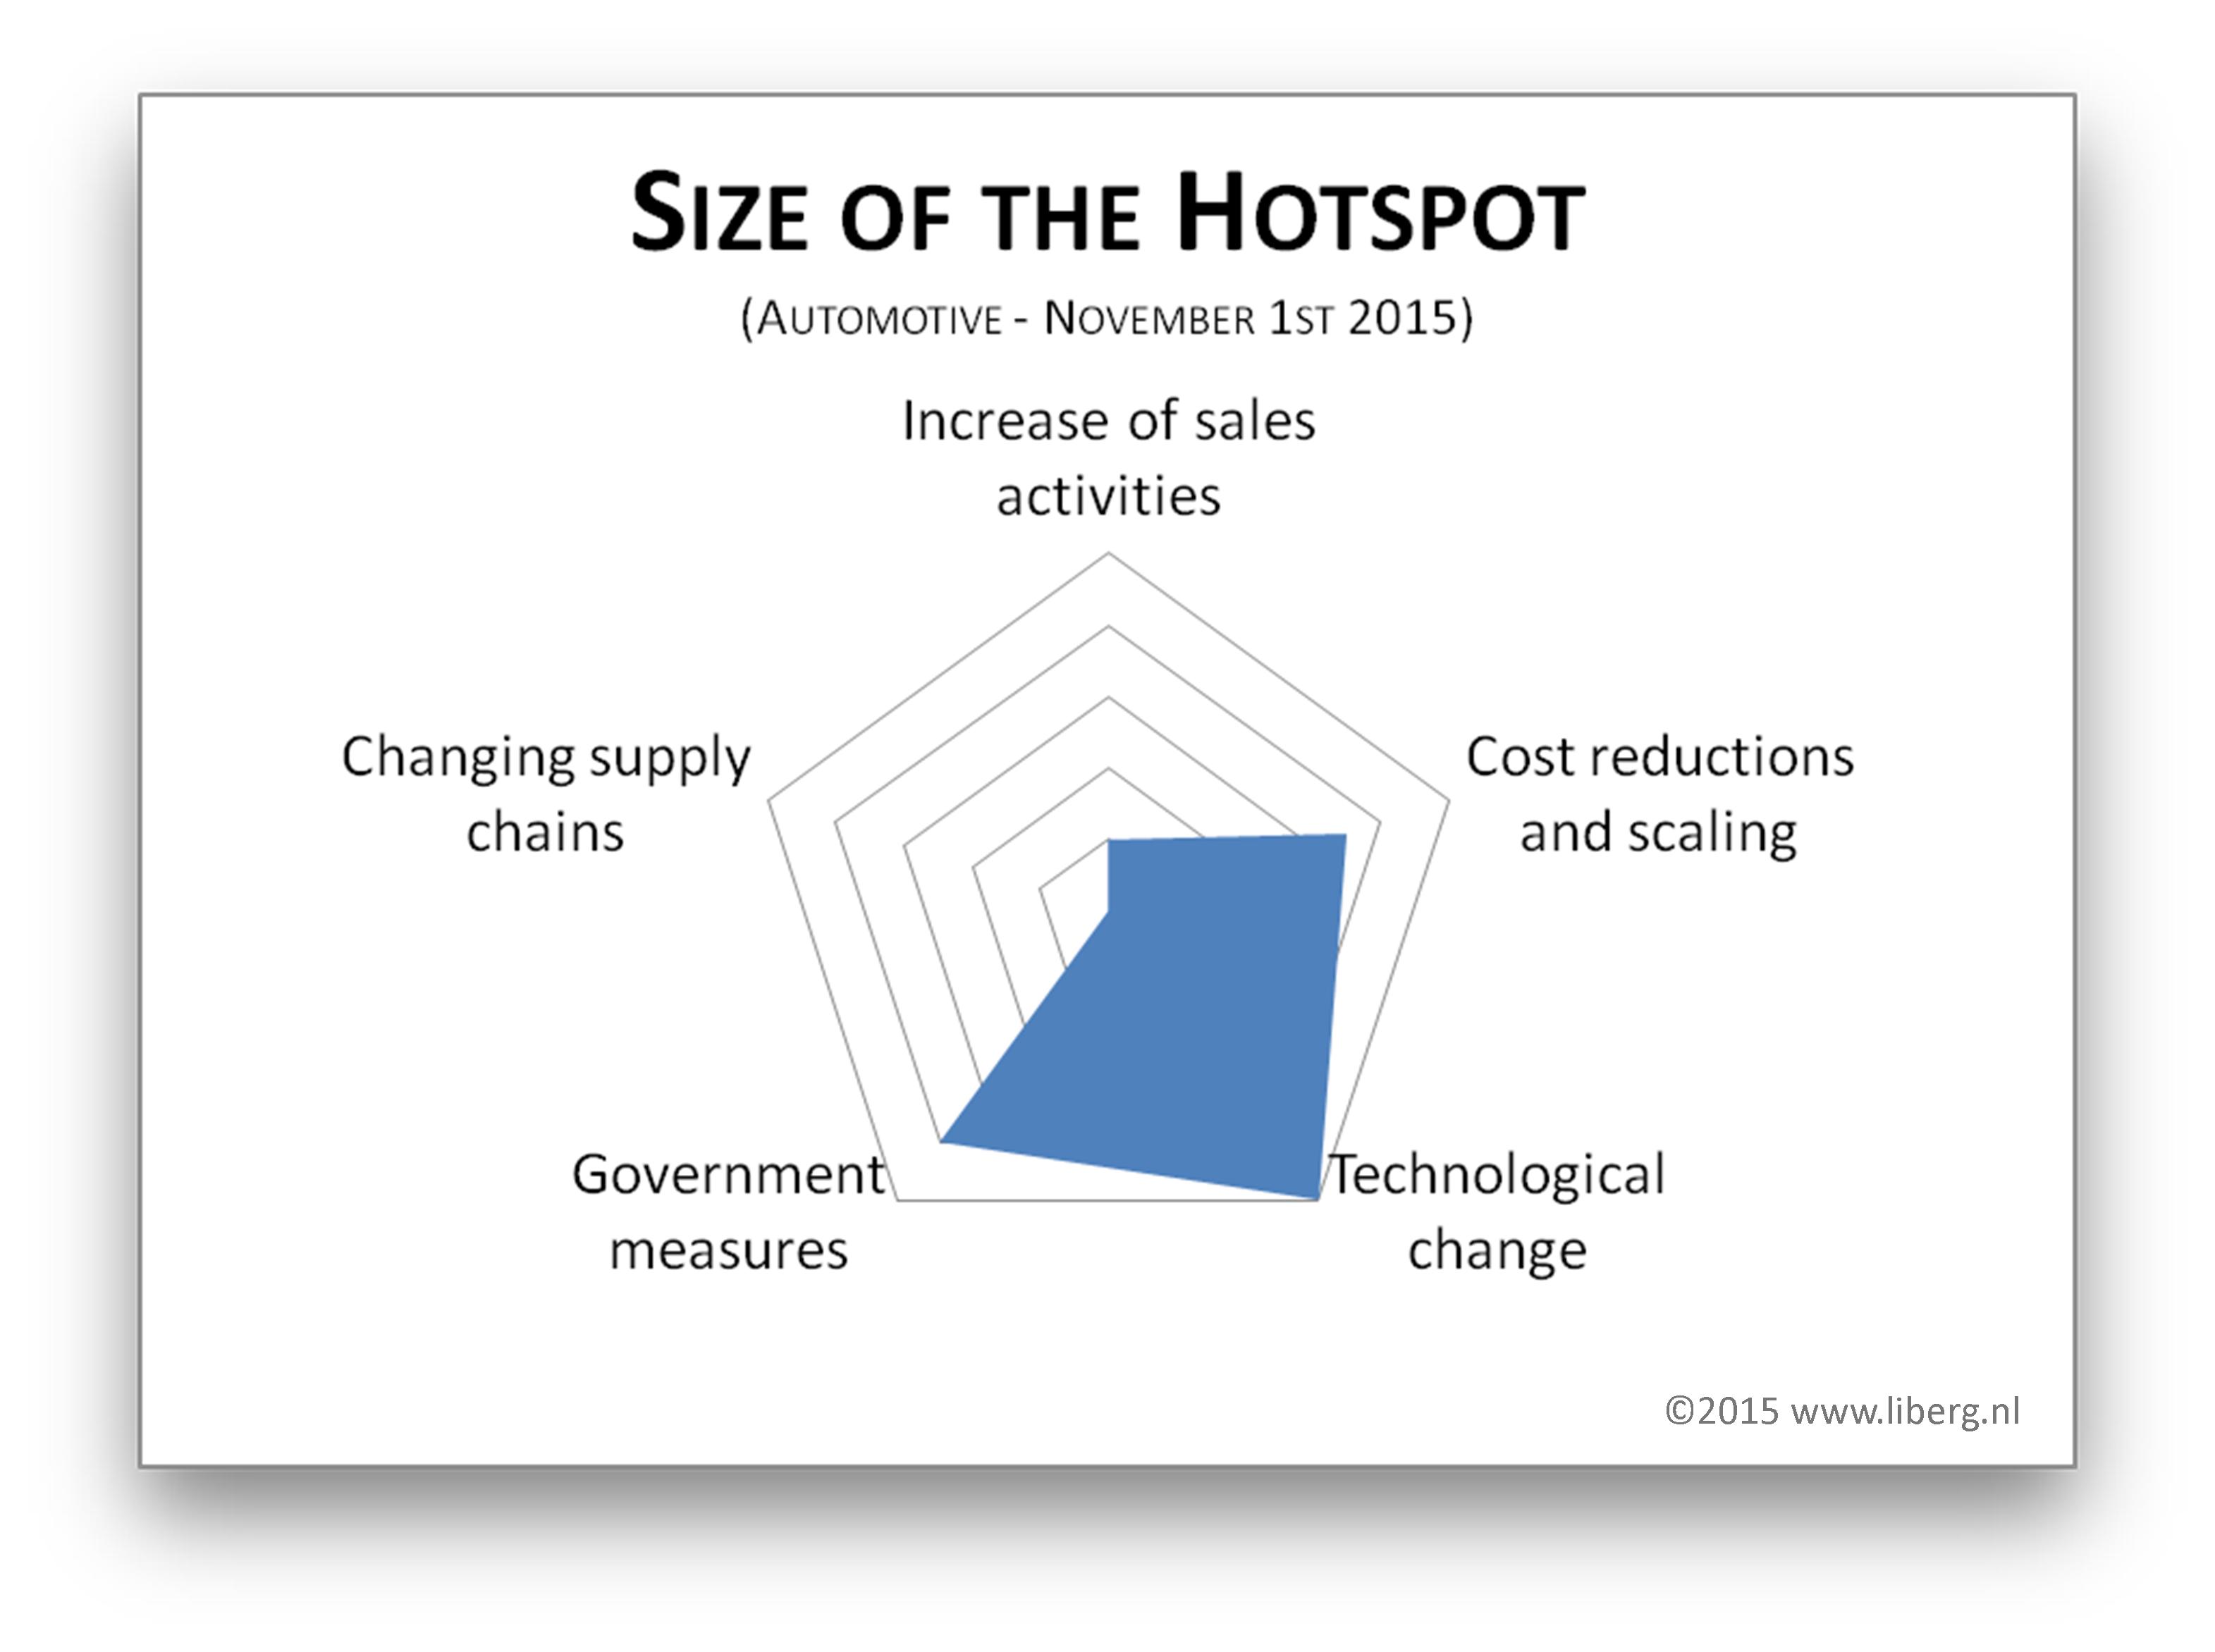
Clue#1 – Increase of sales activities: 2
I have not noticed a significant increase in sales activities.
Clue#2 – Cost reductions and scaling: 7
I notice an increase in cost reduction programs and cooperation in the market, but only a few mergers, and acquisitions.
Clue#3 – Technological change: 10
Massive new technology is emerging.
Clue#4 – Government measures: 8
Governments are increasingly setting new requirements and new rules.
Clue#5 – Changing supply chains: 0
Not much I can see now. Probably this will change within the next decade. If you want to anticipate on that you give a higher rating.
For a graphical presentation of the findings I use a radar-graph. The hotspot I found on my radar looks like this:
In this case I can see the presence of a hotspot. Every hotspot has unique characteristics and therefore a different shape. Like a volcanic hotspot, the hotspot does not need to cover the entire radar to show me its presence. Remarkable characteristics for this hotspot are that supply chains are not changing and there is no significant increase in sales activity. As the volcanic hotspot tells us, things can change rapidly.
Chances of success
The second set of building blocks of the model consist of the “enablers”. You surely remember this exploration in part three. There are five indicators giving insight as to what extent organizations are ready to take advantage of the opportunities bubbling up from the hotspot. If your organization is ready, you can utilize the opportunities and create competitive advantage.
The idea of presenting the findings are the same as the first set of building blocks. Again, in this example I put the Tesla company in mind. I did not interview people from Tesla. The ratings are based on my observations to demonstrate the methodology.
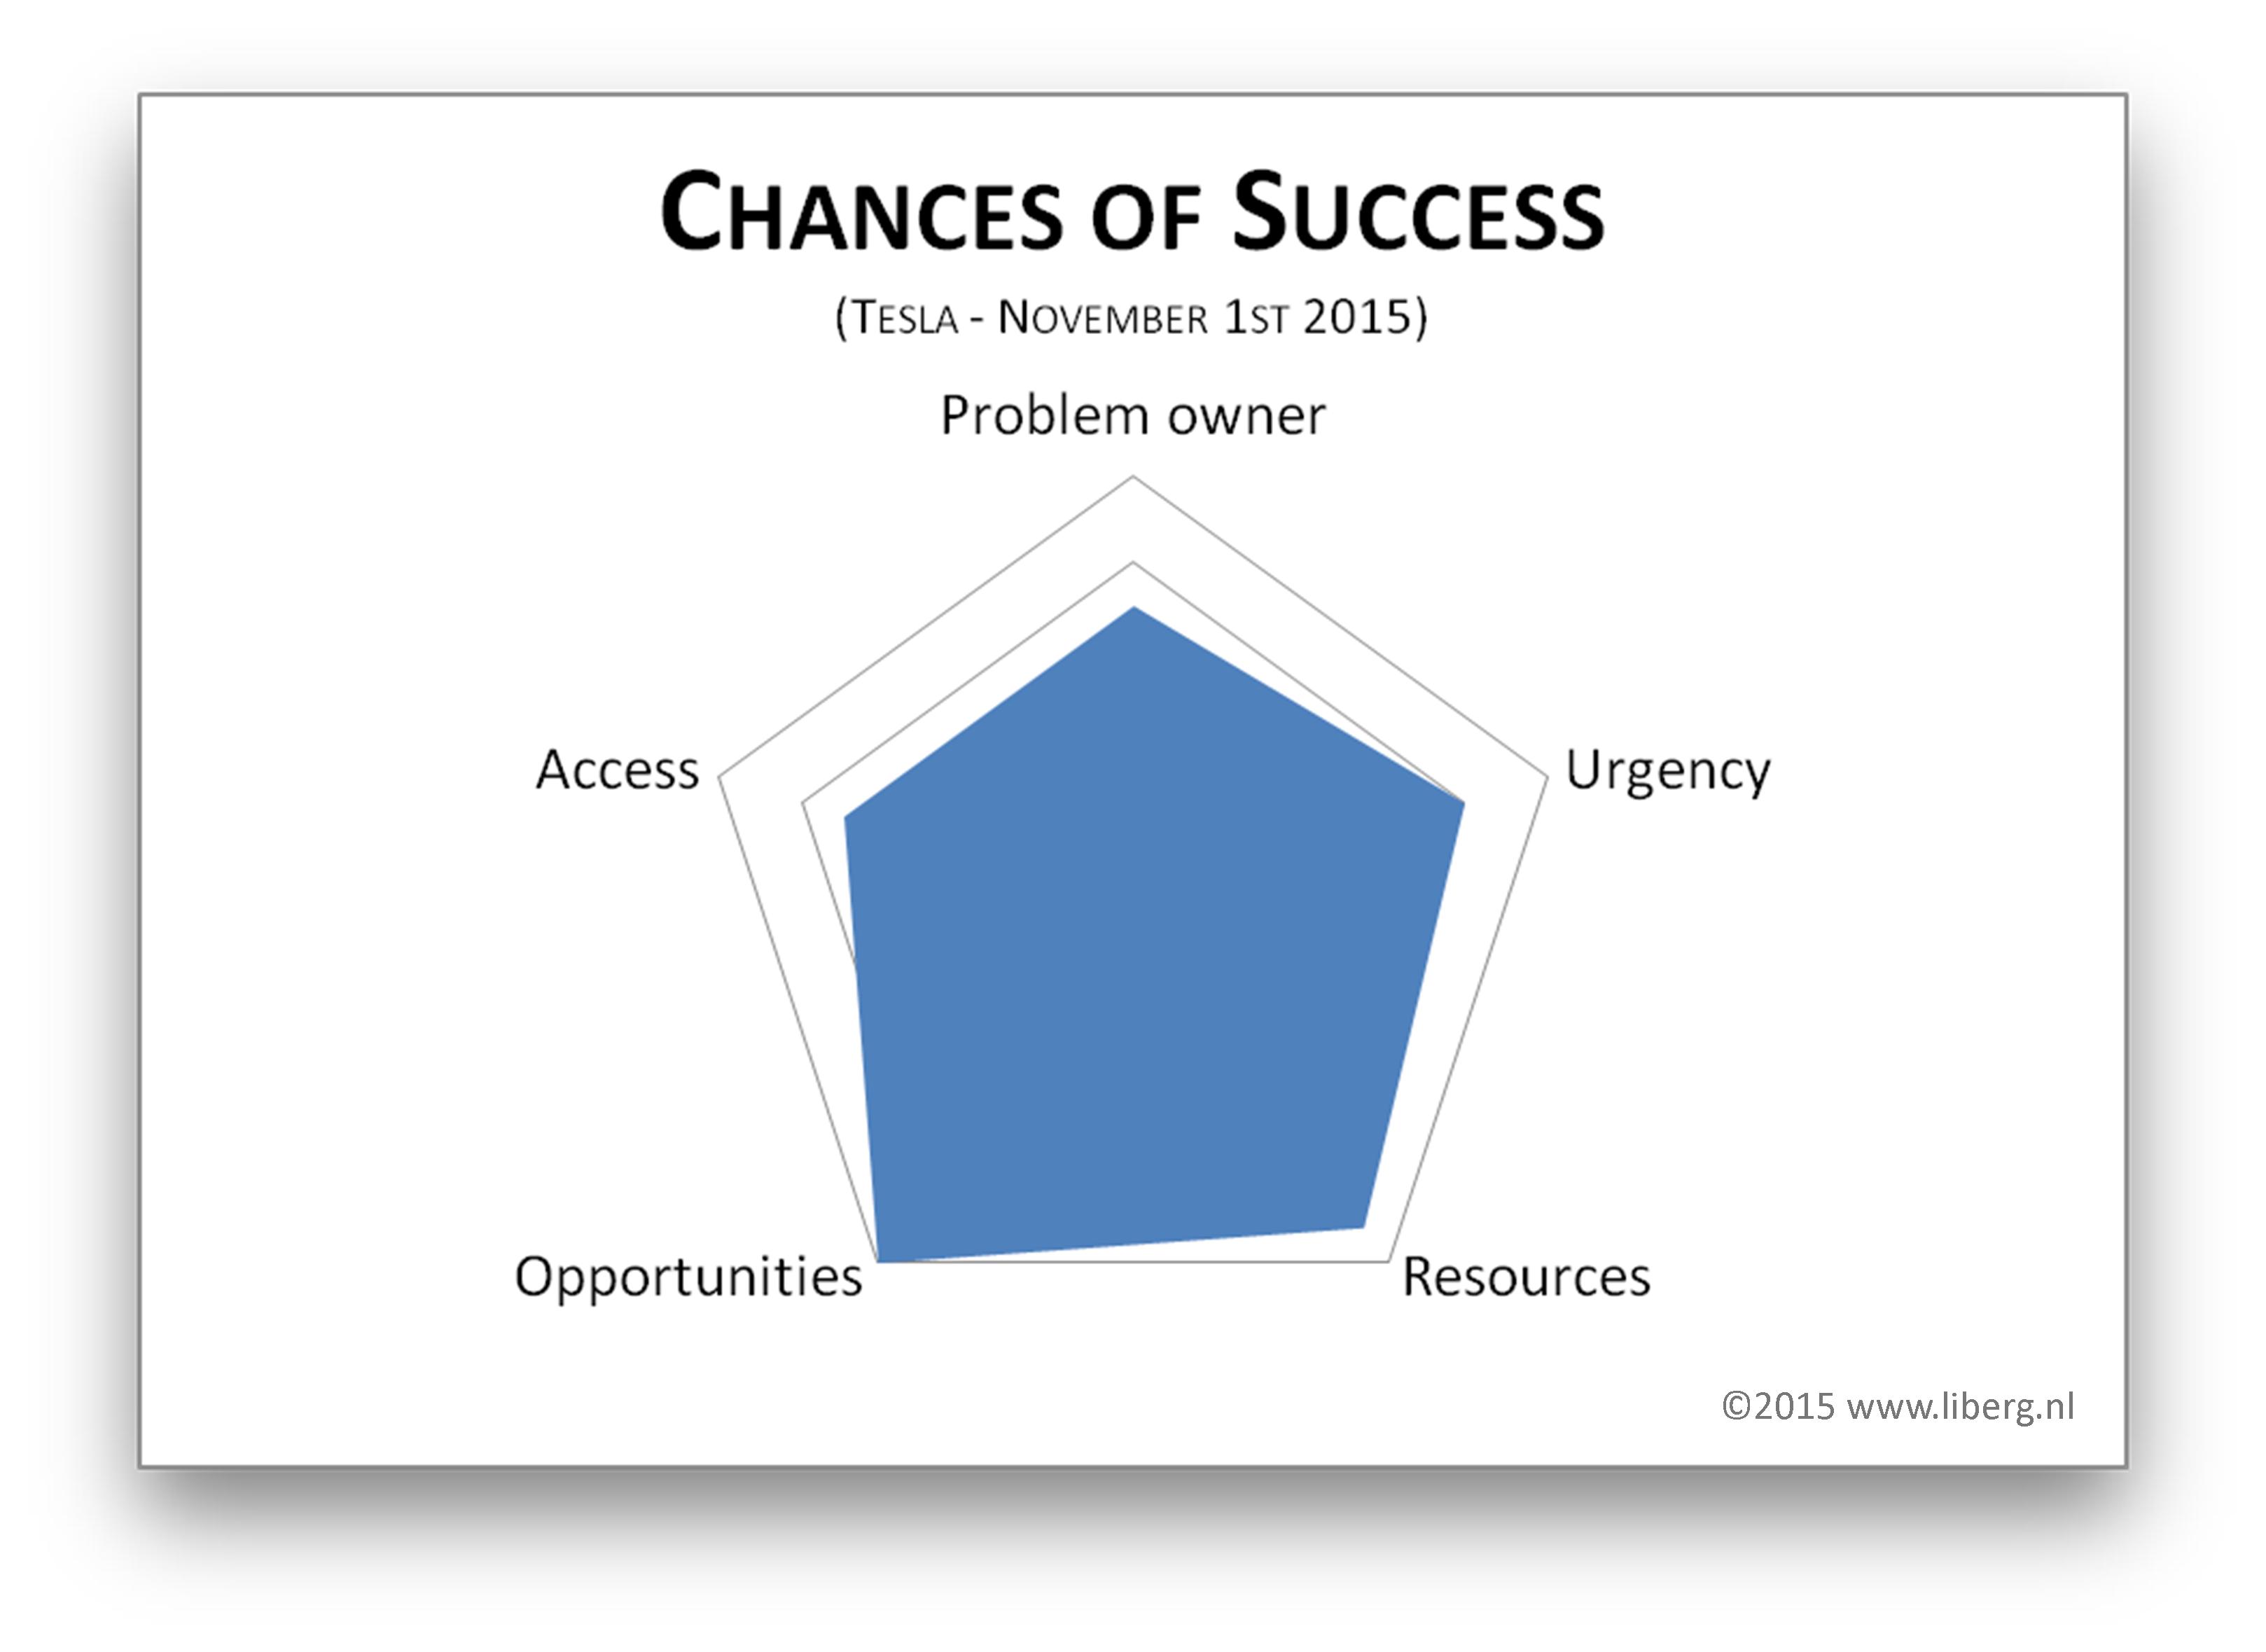
Enabler#1 – Problem owner: 9
Founder and CEO Elon Musk is dedicated to manufacture more affordable electric vehicles (Tesla, 2015).
Enabler#2 – Urgency: 8
Tesla is convinced it needs to focus on mainstream consumers in order to increase market share substantially.
Enabler#3 – Resources: 8
What more to say “Tesla Announces $500 Million Common Stock Offering. Proceeds to accelerate growth of business, including tesla energy, and development of model 3 and gigafactory” (Tesla, 2015).
Enabler#4 – Opportunities: 9
Tesla sees lots of opportunities. “We believe these challenges offer a historic opportunity for companies with innovative electric powertrain technologies and that are unencumbered with legacy investments in the internal combustion engine to lead the next technological era of the automotive industry” (Tesla, 2015).
Enabler#5 – Access: 7
Elon founded his company right on top of a hotspot. You can get his attention if you have the right connections.
If this is the situation with Tesla at this moment in time, the radar-graph would look like the one below.
In contrast to the size of the hotspot, this radar should be pretty well filled for an organization to be ready to engage the hotspot. As discussed in part three, actually all 5 enablers should have a good rating. If this is the case, Tesla is more than ready to exploit the hotspot for great new opportunities for products and services.
Hotspot Model
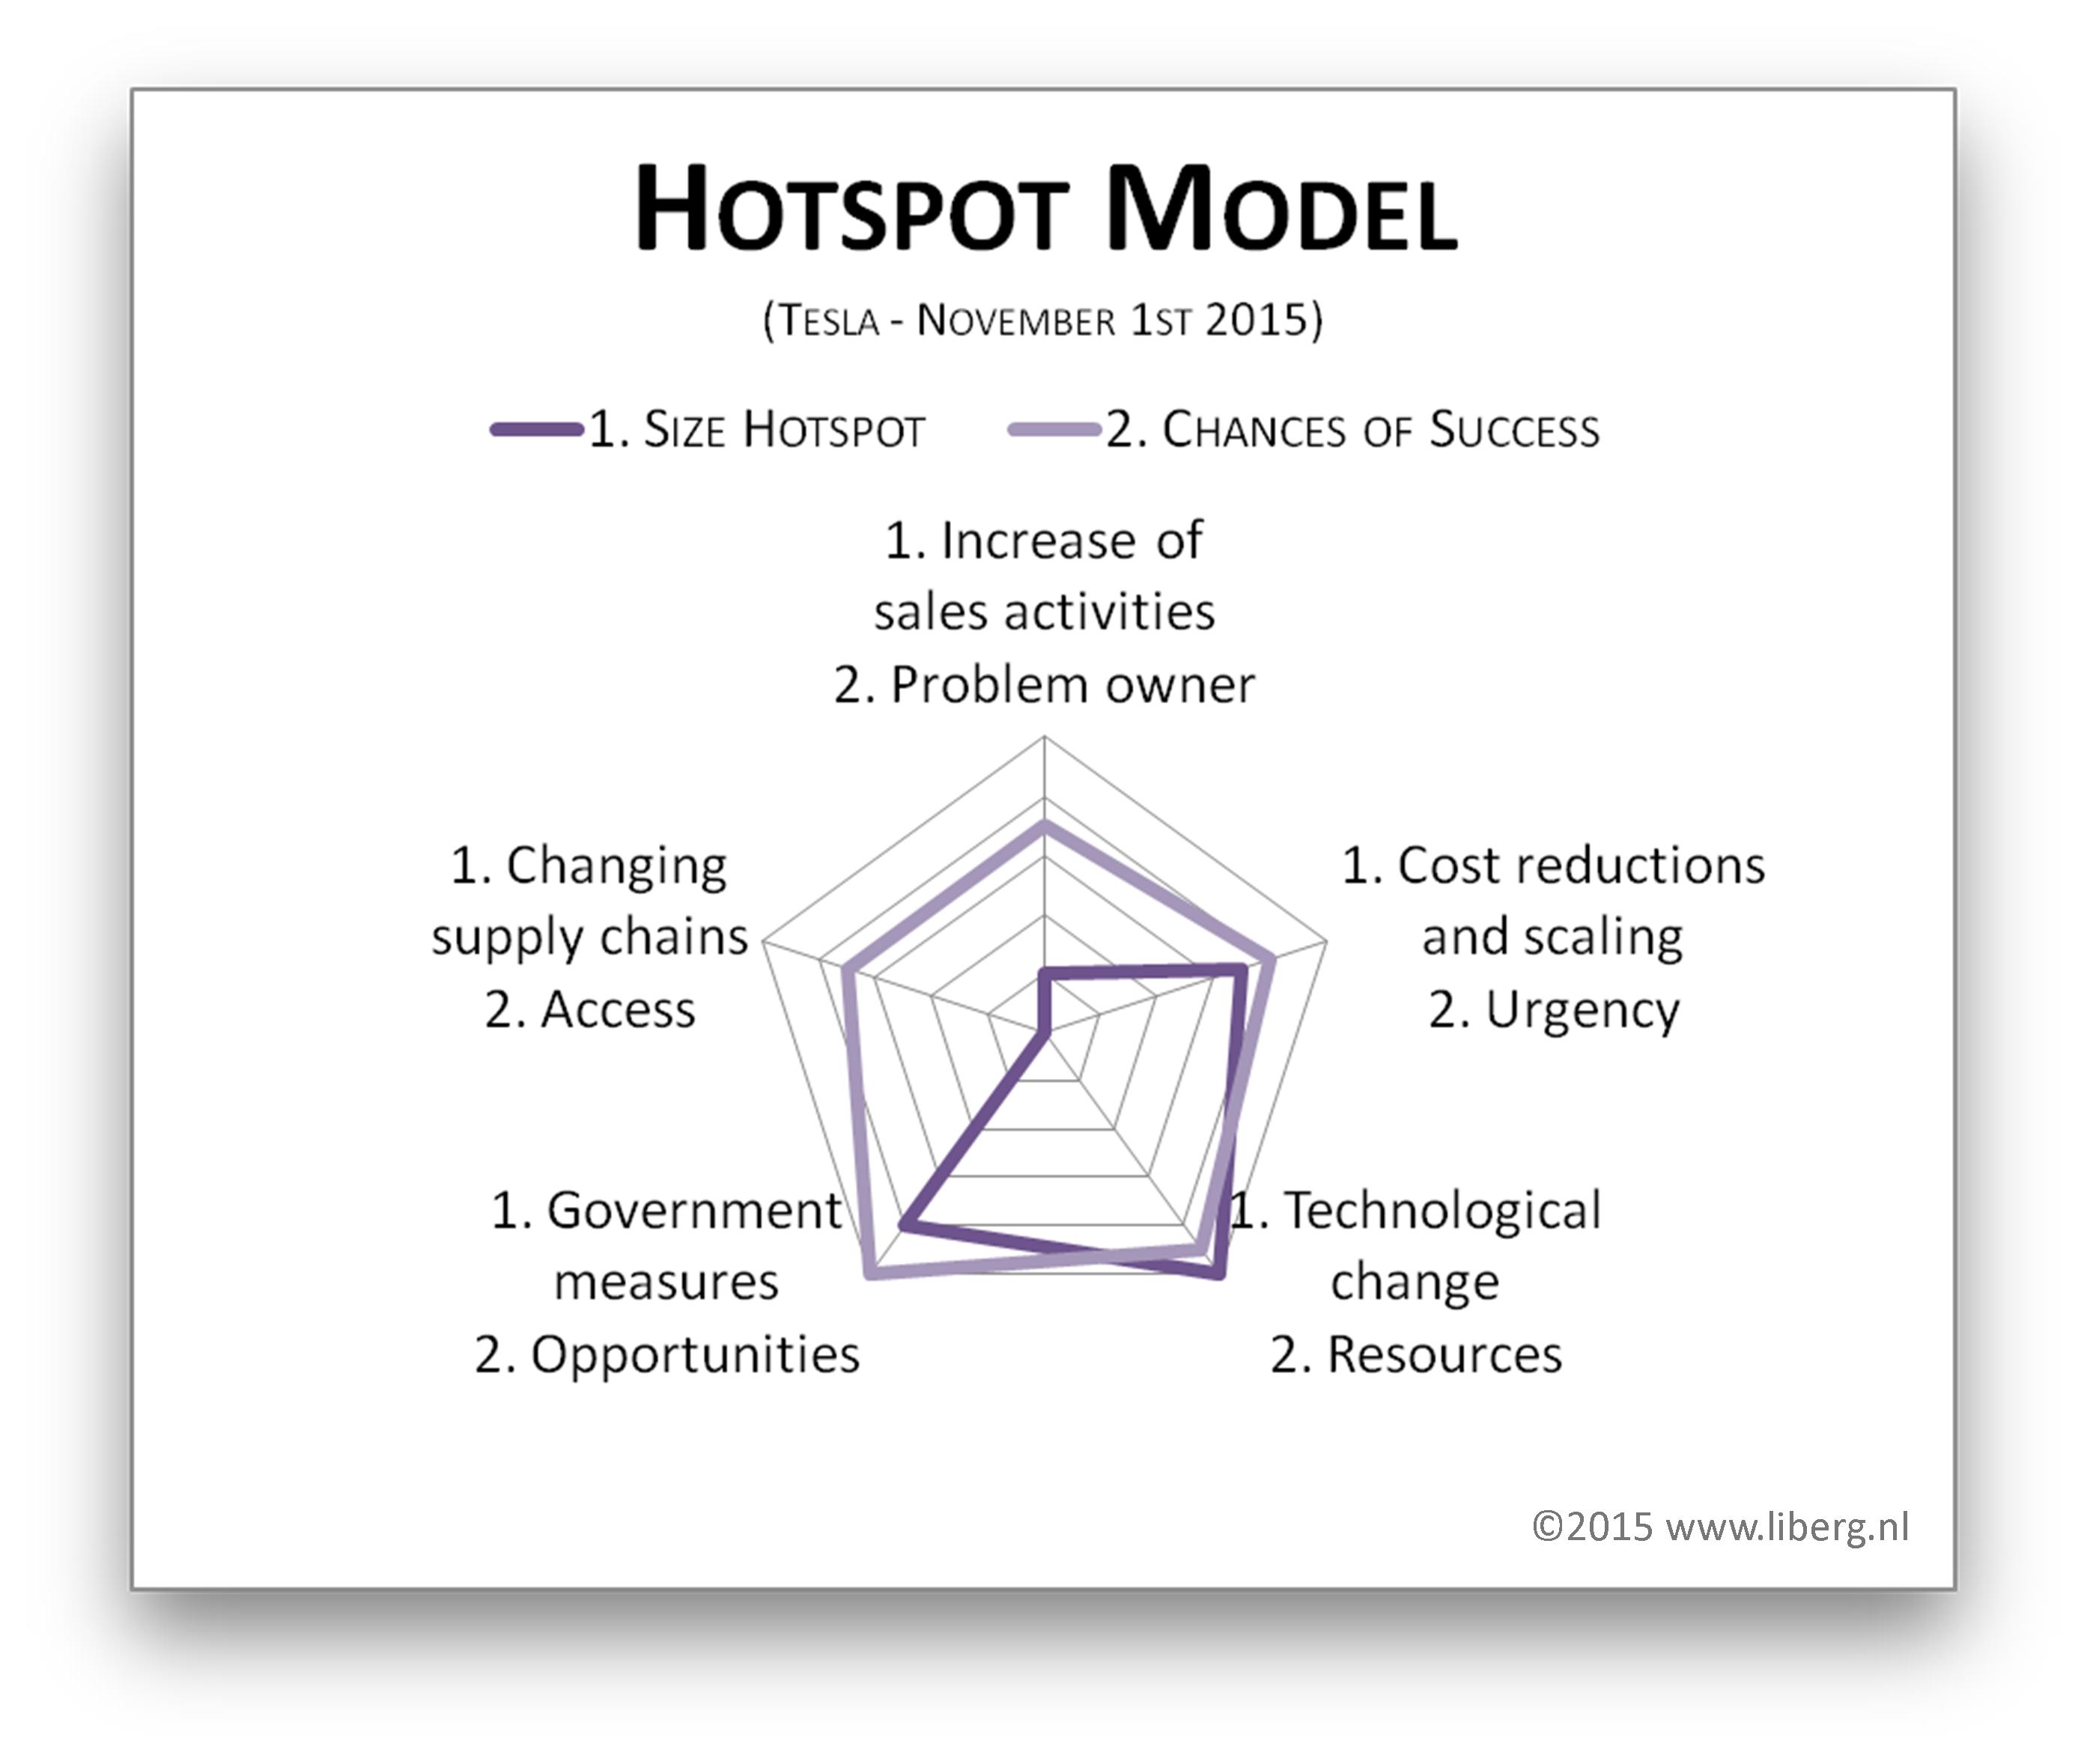
Parts one and two of the model are complete, both with their own stories and argumentation behind them. The final step is to present the findings in a combined radar-graph. Not that this is adding some extra insights, but it might be handy to have the combined story in a convenient double-line graph in a single shot. The combined radar-graph looks as follows.
If you use this model within your organization you can tell much more about every clue, enabler, and the ratings. Of course you make a nice illustrative, concise, well-augmented, dynamic, and interactive presentation of it.
… don’t forget
… if all lights are green
in your final conclusion
… you pop a cork!
Used sources:
Tesla. 2015. Elon Musk Chairman, Product Architect and CEO. Retrieved on October 21st 2015, from http://ir.teslamotors.com/management/elon-musk
Tesla. 2015. Investors Overview, Introduction. Retrieved on October 21st 2015, from http://ir.teslamotors.com/index.cfm
Tesla. 2015. Tesla Announces $500 Million Common Stock Offering. Retrieved on October 21st 2015, from http://ir.teslamotors.com/releasedetail.cfm?ReleaseID=927533
All articles in this series:
- Promising Hotspots for Business Development
(part one: introduction) - How to Find Promising Hotspots for Business Development
(part two: the clues) - When to Engage in Promising Hotspots for Business Development
(part three: the enablers) - How to Model Hotspots for Business Development
(part four: the finish)
If you’re thinking about renovating or innovating your products or services, and would like insight, guidance, or help, I’d love to chat with you.
- Check out my references and view my previous work
- Connect with me on LinkedIn


